Every client website, one clear report a month.
We look after dozens of live client websites, and every owner deserves a straight answer to one question: is my website working for my business? So we built Launch Site Reports. It gathers each site’s numbers on its own, watches every site around the clock, and Claude drafts a plain-English report that a person checks before it goes out.
Claude drafted October’s report
Summary, 3 highlights, 1 thing to watch and 1 suggestion, from the numbers and our work log.
Waiting for a person to approve
10+
data sources per client
5 min
between uptime checks
24
months of history per client
1
click to approve and send
Why we built it
Hours of copy and paste, or a generic dashboard.
Pulling numbers out of Google Analytics, Search Console and speed tests by hand took hours for every client, every month. Off-the-shelf reporting tools charged per client and produced dashboards full of charts that small business owners never read. We wanted something that does the gathering itself, explains what changed in plain words, and never sends a number nobody has looked at.

Everything in one place
It gathers the numbers, so we don’t have to.
A secure robot account with read-only access collects each client’s data on a schedule. Nothing is copied by hand, and every number in a report can be traced back to where it came from.

Google Analytics
Visitors, where they came from, phones versus computers, top towns and pages, phone taps and every key action.
Google Search Console
The searches people used to find the site, clicks from Google and the client’s chosen keyword rankings over time.
Form leads
Read straight from each site’s own lead inbox, split into real inquiries and newsletter signups, with spam left out.
Speed and site health
Google PageSpeed scores for phone and computer, plus a monthly scan of every page for broken links and errors.
Reviews and Business Profile
Google rating and review count, plus calls, direction requests and website clicks from the Business Profile.
Ad results
Google Ads spend, clicks and cost per lead, and Facebook and Instagram ad visits and leads, next to everything else.
AI that drafts, people who decide
Claude writes the first draft. A person signs off.
Each month Claude, Anthropic’s AI model, reads a client’s numbers against last month and last year, plus the list of work we did on their site. It writes a short summary, three highlights, one thing worth watching and one suggestion, in the plain language an owner would use. Every monthly report waits in a review queue until someone on our team reads it, edits it if needed and approves it.
- Only uses the numbers we collected, never guesses
- Turns our code changes and admin edits into “What we did this month”
- Structured output, so every report has the same clear shape
- Nothing goes to a client without a person’s approval
Reports to review
sample data
Drafted by Claude · October 2026
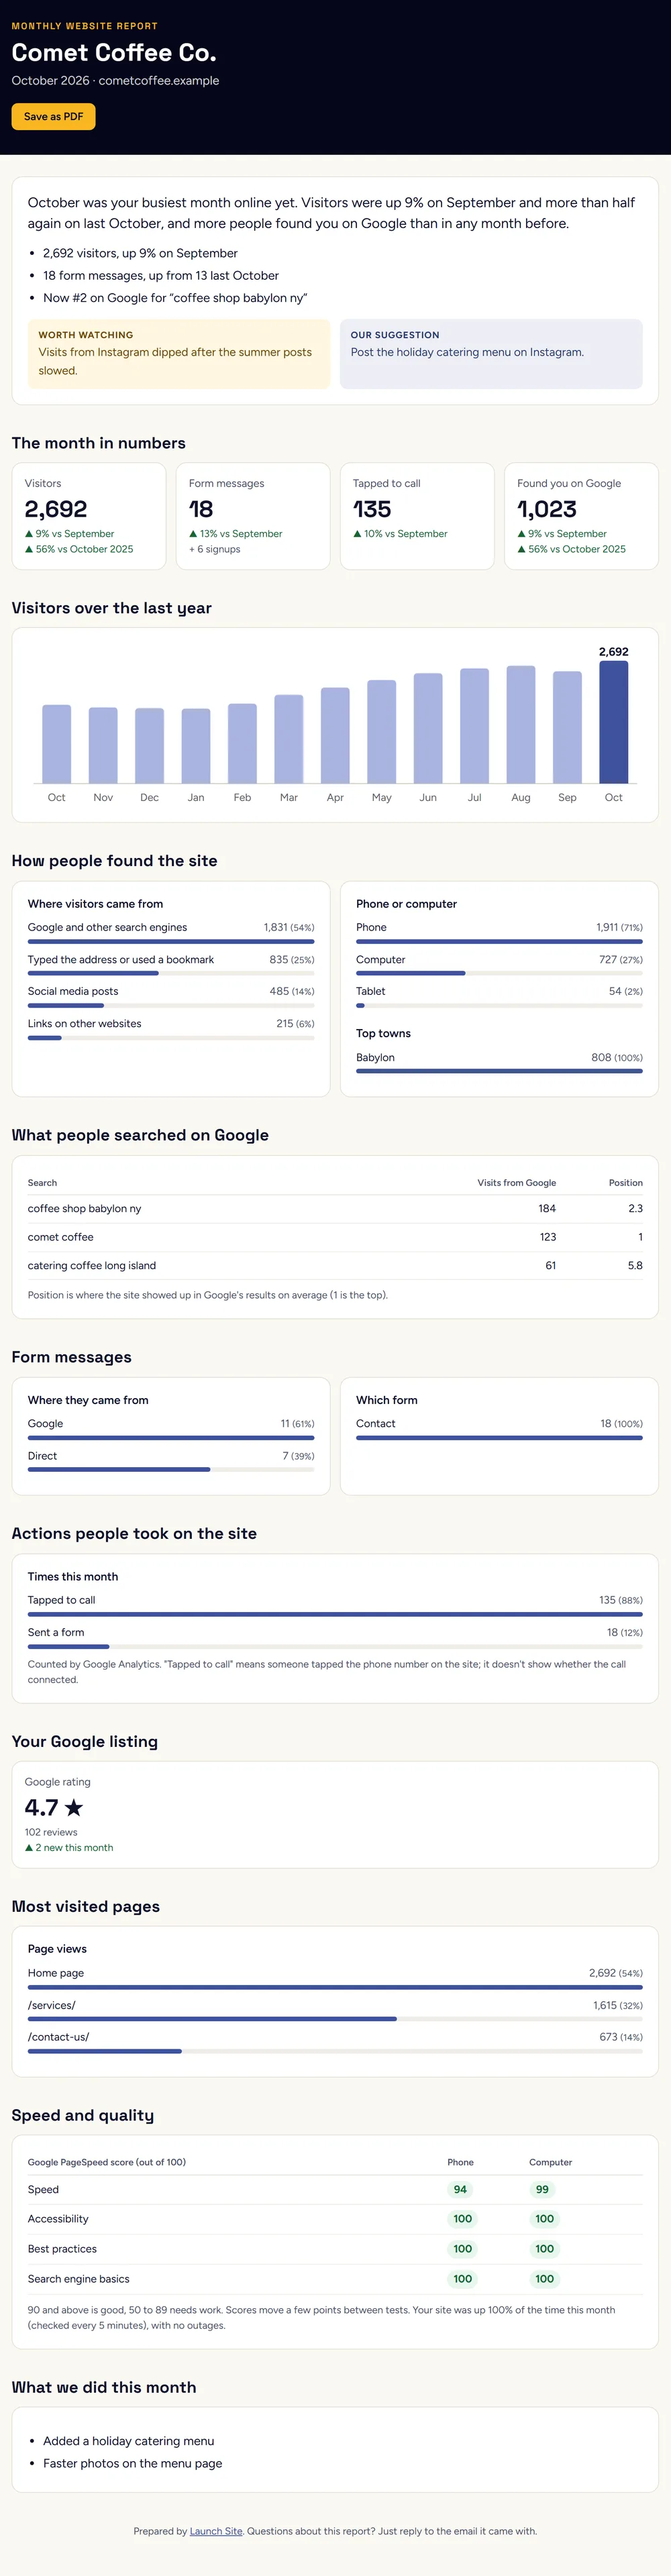
October was your busiest month online yet. Visitors were up 9% on September, and more people found you on Google than in any month before.
- 2,692 visitors, up 9% on September
- 18 form messages, up from 13 last October
- Now #2 on Google for “coffee shop babylon ny”
Worth watchingVisits from Instagram dipped after the summer posts slowed.
Our suggestionPost the holiday catering menu on Instagram.
What clients get
A report an owner actually reads.
Each client gets a private link and a PDF: the summary up top, the month in numbers, a year of visitors, how people found the site, what they searched on Google, leads, their Google rating, top pages, speed and the work we did. This sample uses a made-up coffee shop, so no real client’s numbers are shown.
Uptime · every 5 minutes
last check 2 min ago
- cometcoffee.example182 ms100%
- harborlightbakery.example214 ms100%
- starboarddevelopments.example167 ms99.98%
Down 10 min on Oct 14 · emailed us at 2:05 pm
- northshoreplumbing.example241 ms100%
Last week, compared with the week before:
- Visitors
- 412
- ▲ 6%
- Form messages
- 7
- ▲ 2
- Taps to call
- 19
- ▼ 1
Month so far: 1,190 of your 1,600 visitor goal.
Watching around the clock
We hear about problems before the client does.
Every live site is checked every five minutes. If it fails twice in a row, we get an email right away, and the outage shows up in that month’s report with how long it lasted. Clients who want a quick pulse also get a short email every Wednesday with last week’s numbers next to the week before and their goals for the month.

Inside the app
The real screens, with made-up clients.
These are screenshots of Launch Site Reports itself, running with sample businesses so no real client’s numbers are shown.
- reports · client dashboard
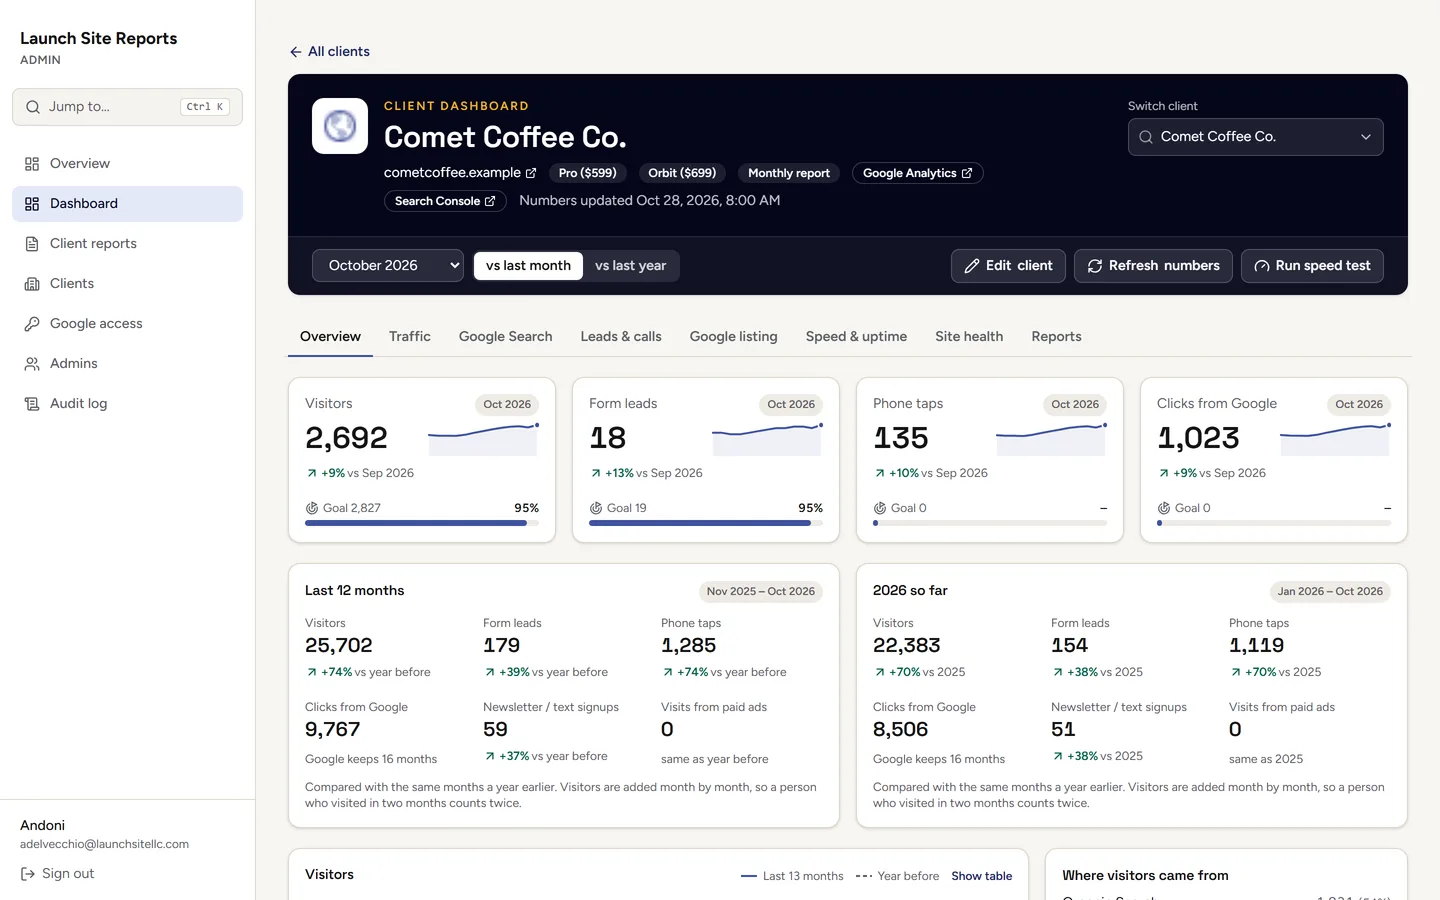
Client dashboard. One client at a glance: this month against last month or last year, goals and the year so far.
- reports · traffic tab
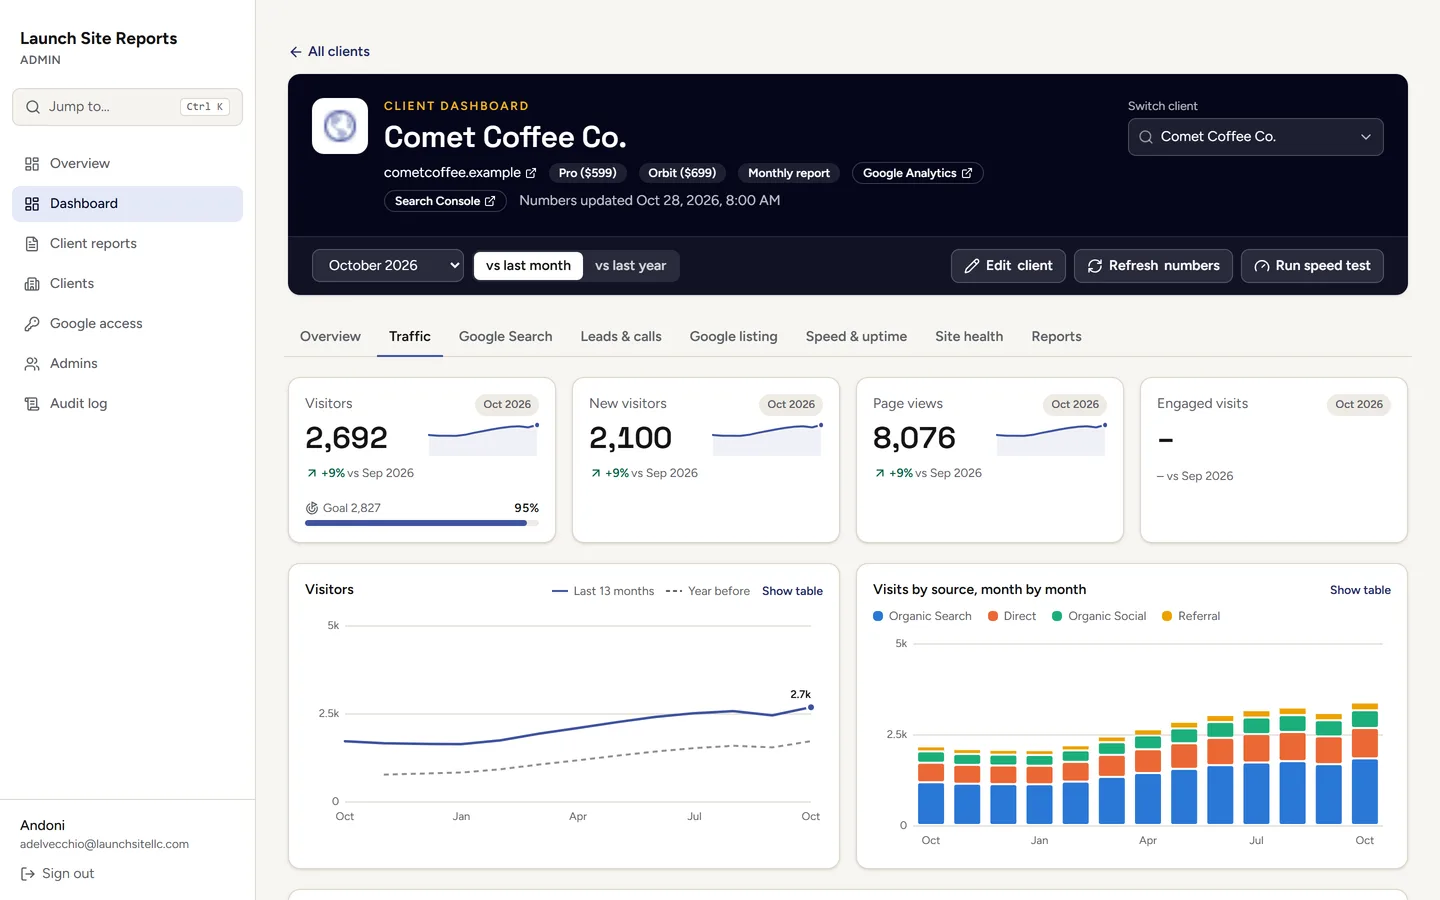
Traffic tab. A year of visitors with the year before dashed in, and where they came from, month by month.
- reports · client reports
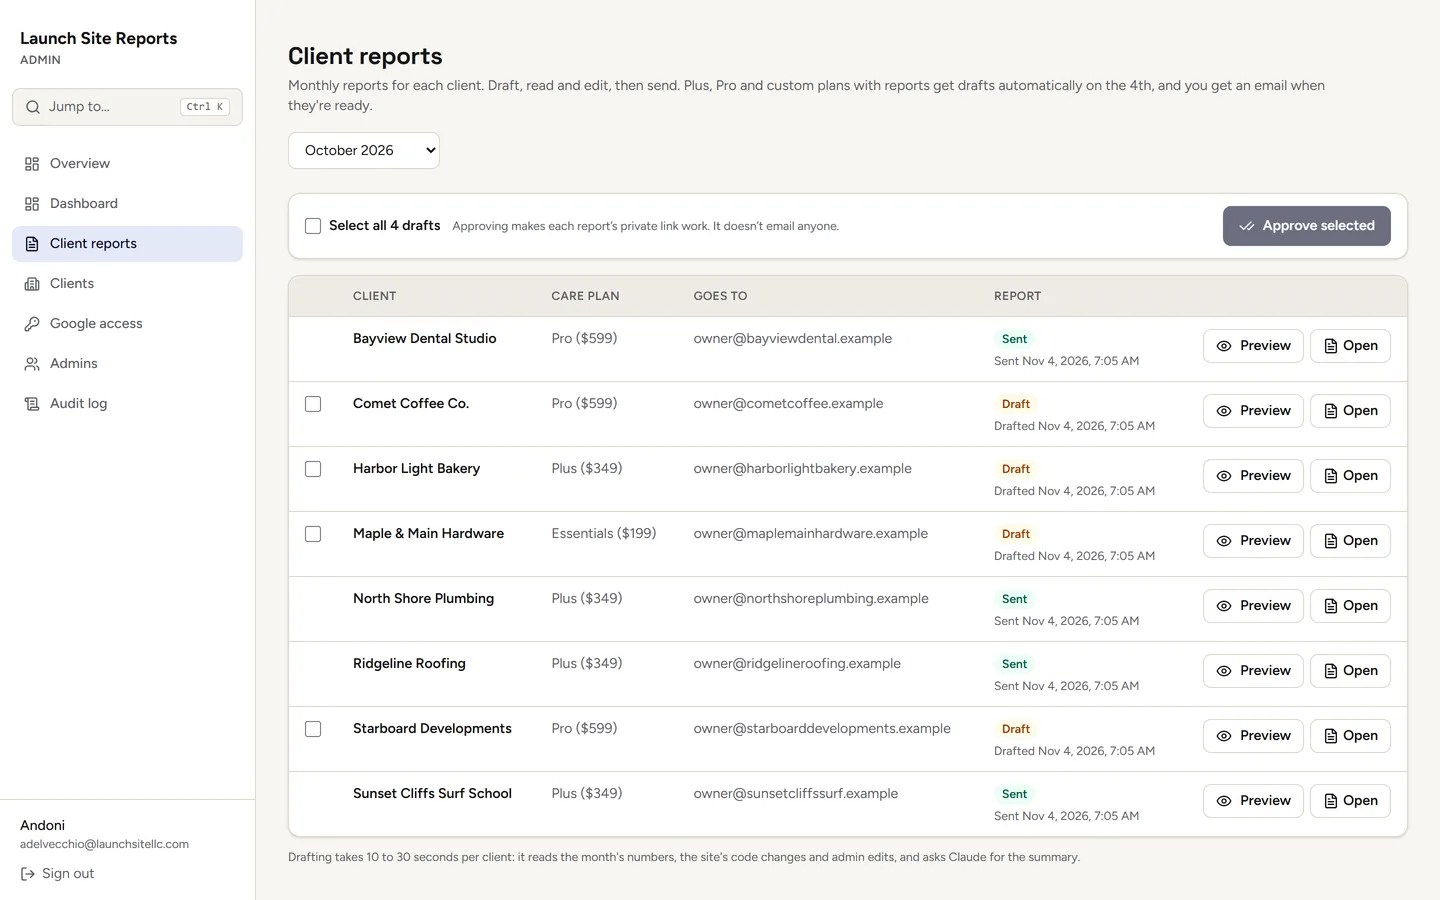
Client reports. Every client’s monthly report in one list, drafted on the 4th, approved one by one or several at once.
- reports · report editor
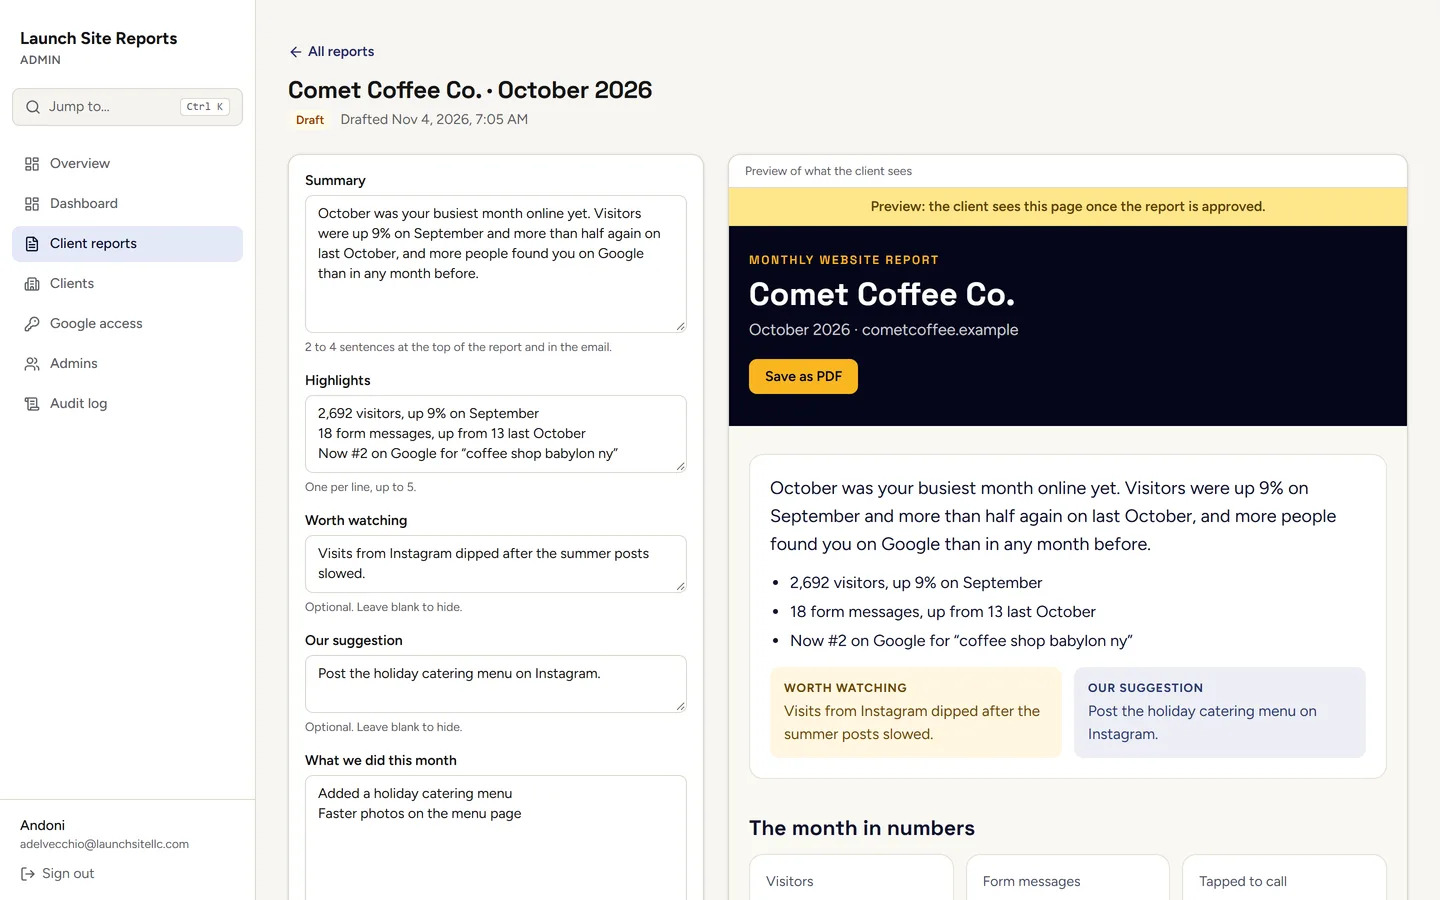
Report editor. Claude’s draft on the left, exactly what the client will see on the right.
For our team
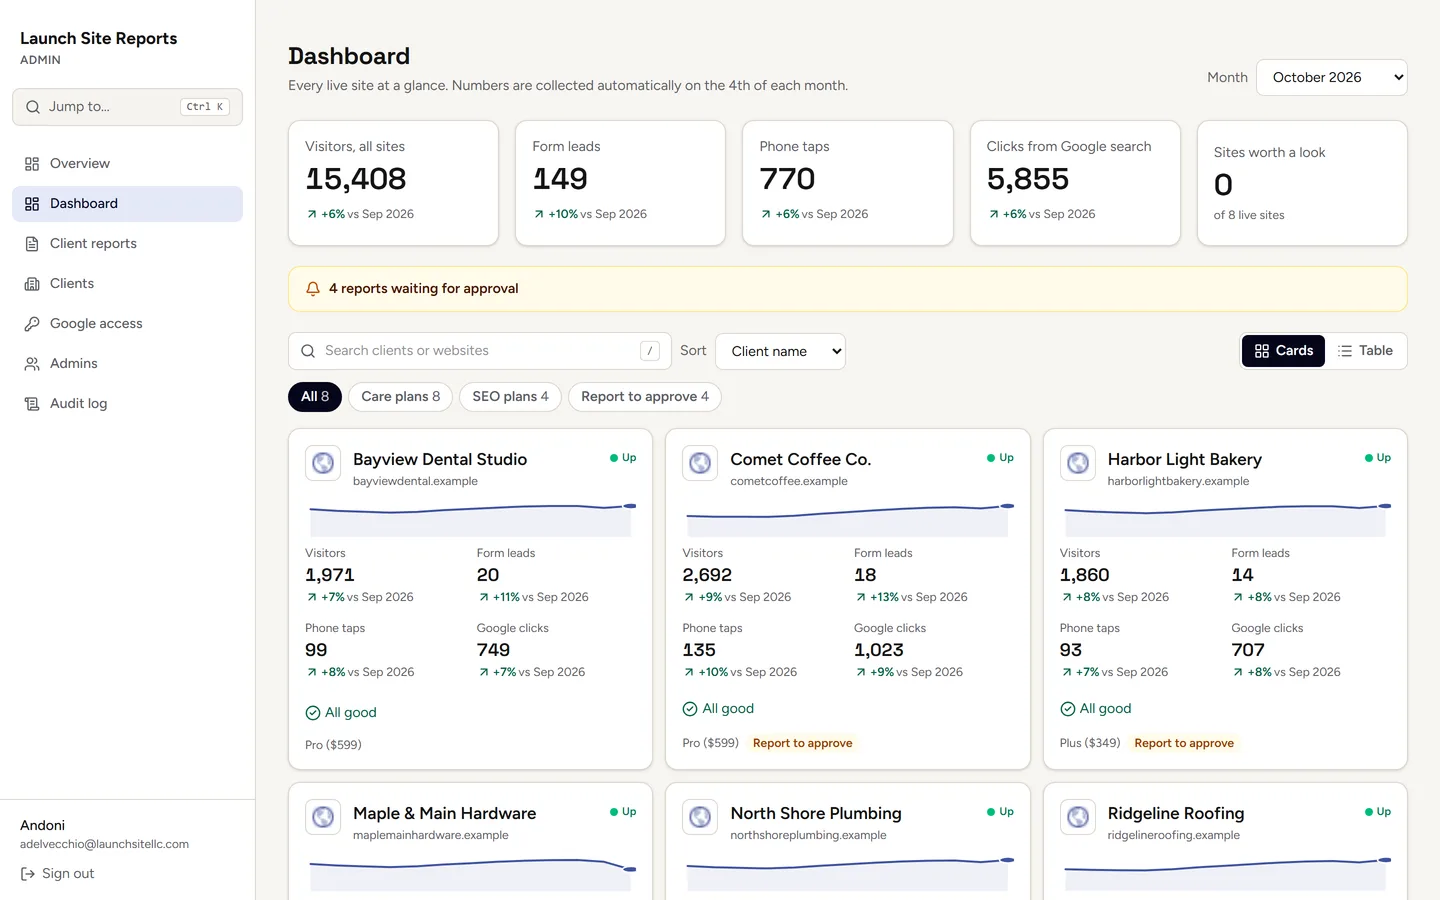
Every client at a glance, what needs attention first.
- Client cards with search, filters and a needs-attention strip
- A tab for each client: overview, traffic, search, leads, speed, ads and past reports
- This month against last month or last year, with goals for visitors, leads and calls
- A quick switcher (Ctrl+K) to jump to any client
- Approve several reports at once, with a preview right from the list
Under the hood
Built on the same foundation as our client sites.
React admin app
A private app behind a password, Google sign-in and bot protection, on the same admin foundation we give every client.
Scheduled cloud jobs
Google Cloud functions collect each month’s data, check uptime every five minutes and send the Wednesday emails.
Google APIs, read-only
Analytics, Search Console, PageSpeed, Places and Business Profile, through a robot account that can only look, never change.
Claude API
Claude drafts each report in a fixed structure from the numbers and the work log. The review queue flags any report it could not draft.
PDFs and email
Reports render to a print-ready PDF in a headless browser and go out by email with a private link that only opens once approved.
History built in
Two years of monthly snapshots per client, so every report compares against last month and the same month last year.
Still building reports by hand?
We build internal tools like this one: they gather the data, use AI where it helps, and leave the decisions to your team.